|
<< Click to display Table of content >> Adding of a display window for source contributions |
  
|
|
<< Click to display Table of content >> Adding of a display window for source contributions |
  
|
Adding of a display window for source contributions
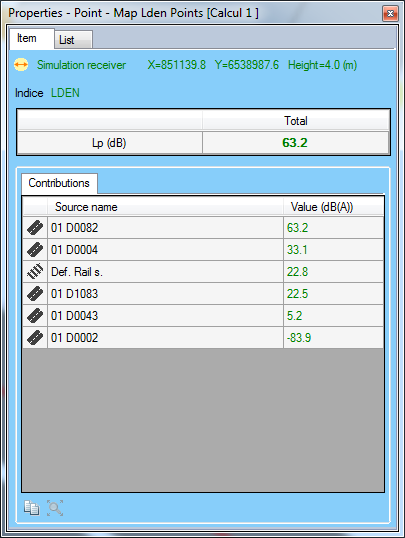
A new interface showing simulation results has been added. It displays the details of the contributions of each source at each point in the domain.
It is displayed in the Object tab of the Properties window when you select a point from a Points map.

We can therefore quickly visualize:
•The location of the receiver corresponding to the selected point
•The height of the receiver
•The indicator associated with the map
•The overall pressure level
•Details of the contributions of each source to the overall pressure level
On a calculation with storage by frequency, with a map detailing the frequencies, it is also possible to view the detail by frequency.
For more information, go to the Contributions page in the documentation.