|
<< Click to display Table of content >> Contributions |
  
|
|
<< Click to display Table of content >> Contributions |
  
|
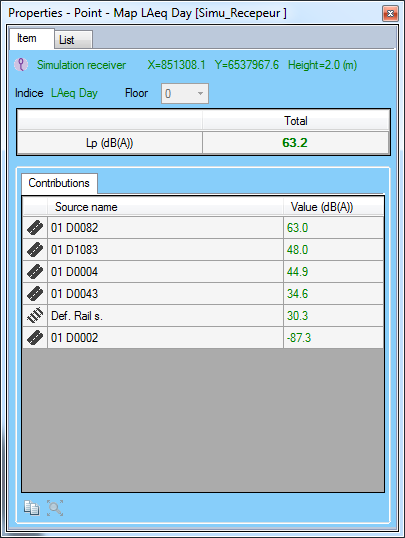
When creating Point type maps, regardless of the type of simulation, an interface detailing each of the contributions of the sources is accessible in the Properties window.

Contributions window
In this window, we find the following information:
•An icon indicating the type of simulation
•A text indicating the type of point in question: Simulation receiver or Max level
•The position of the point: its X and Y coordinates as well as its height from the ground
•The corresponding indicator
•The receiver floor in the case of a facade receiver
•The measured level (Lp) in dBA
•Details of the contributions from each source:
oThe name of the source
oThe level in dBA to which the source contributed for this simulation receiver. The higher this level, the more impact the source has on the simulation result.
A level of -99 dBA indicates that the source had no impact on the result.
oWhen a source is selected, it is possible to zoom the view above by clicking on the ![]() button or by double-clicking on it.
button or by double-clicking on it.
It is possible to copy the details of these contributions to the clipboard by clicking on the ![]() button.
button.
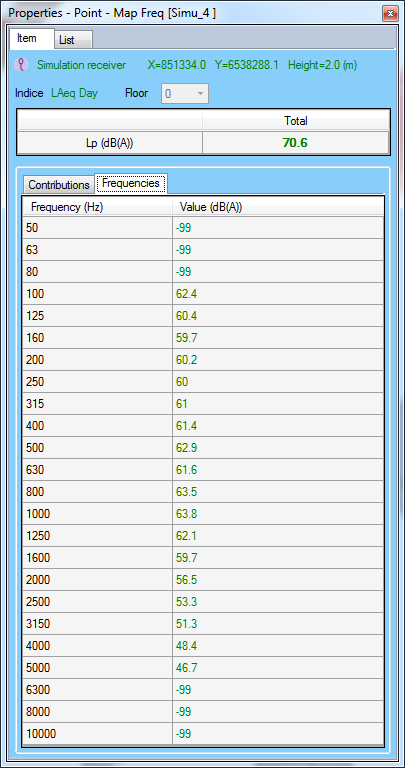
Frequencies
In the case of a Points type map detailing the results by frequencies, the contributions window also specifies the level measured for each frequency.

Detail of the pressure level by frequency
To create a map with the details of the frequencies, select the Details option when choosing the frequency when creating the map.
This map must be based on a simulation with a storage mode by frequency.
Display the Contributions window
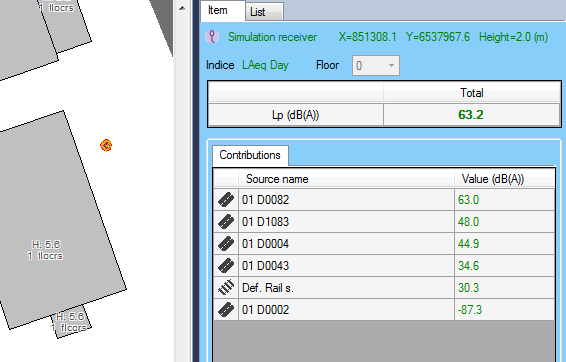
To display the details of the contributions of the sources at a given point, select a point from the corresponding Points map.

Sélection of a point to display contributions