|
<< Click to display Table of content >> Statistics |
  
|
|
<< Click to display Table of content >> Statistics |
  
|
There are 2 types of window:
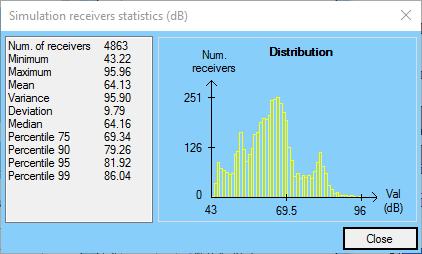
Receivers statistics
This interface can be accessed from the map window and the ![]() button and shows statistical results for points representation.
button and shows statistical results for points representation.

Points statistics window
The histogram represents the results distribution every 1 dB and is updated in real time (when the 'real time' option is active) with each modification of the parameters of the map window. The minimum and maximum values of the histogram correspond to those receivers.
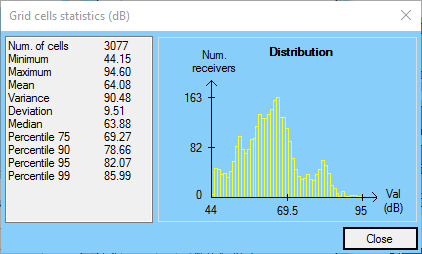
Grid's cells statistics
This interface can be accessed from the map window and the ![]() button and shows statistical cells' value for grid representation.
button and shows statistical cells' value for grid representation.

Grid's cells statistics window
The histogram represents cells' value distribution every 1 dB et is updated in real time (when the 'real time' option is active) with each modification of the parameters of the map window. The minimum and maximum values of the histogram correspond to those cells.