|
<< Click to display Table of content >> Parameters and representations |
  
|
|
<< Click to display Table of content >> Parameters and representations |
  
|
Methods of representation:
Grids
•Grid, defined by its resolution:
Horizontal simulation |
|
|---|---|
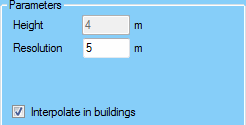 Grid parameters |
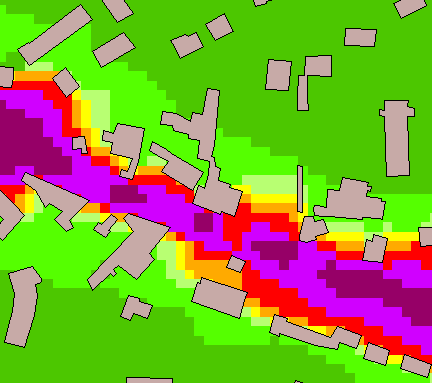 Grid view |
oThe Resolution corresponds to the distance that a pixel represents. A resolution of 5m means that 1 pixel = 5m. To avoid excessive interpolation, this value should be related to the receiver resolution chosen for the simulation.
oThe Interpolate in buildings option makes it possible to obtain a complete map with buildings. This option modifies the simulation of areas.
oIf several simulation heights have been entered during creation of the domain, a drop down menu allowing you to select the height of the map is available.
Important: A grid map will not be "flat" in 3D view. The dB value is stored in the Z of the pixels of the grid for the export. Due to that, in 3D view, the Z of the pixels will be interpreted as an elevation and the map will be in relief.
Points
•Points directly representing the simulation receivers:
Horizontal simulation |
|
|---|---|
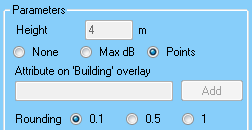 Receiver parameters – Horizontal simulation |
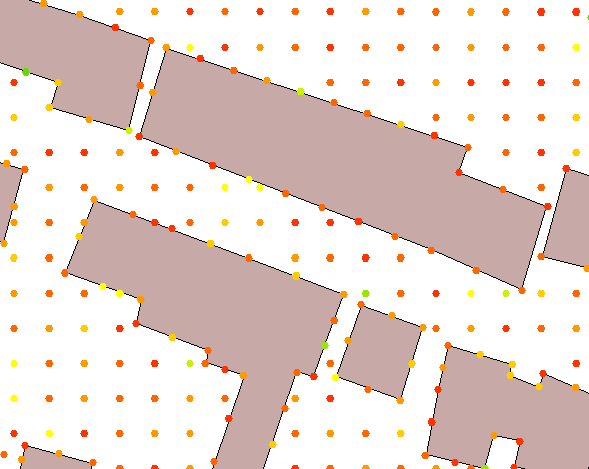 Receivers view - Horizontal simulation |
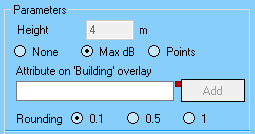 Max dB parameters - Horizontal simulation |
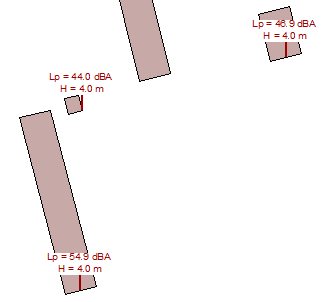 dBMax view - Horizontal simulation |
oWith the None option, there is no visualization (optimization to have a quick access to population information and statistics).
oThe Max dB option allows you to see the maximum level value for each building.
oThe Attribute on 'Building' overlay corresponds to the name of the attribute that the user can add to each building: its value is the dB Max value simulated on the building.
Facade simulation |
|
|---|---|
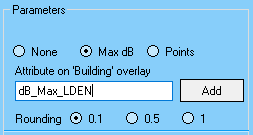 Parameters – Facade simulation |
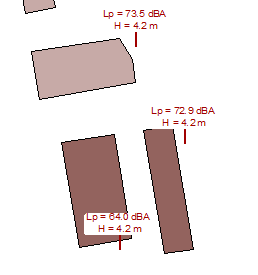 Receivers view – Facade simulation |
Receivers simulation |
|
|---|---|
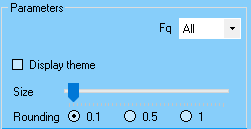 Parameters – Receivers simulation |
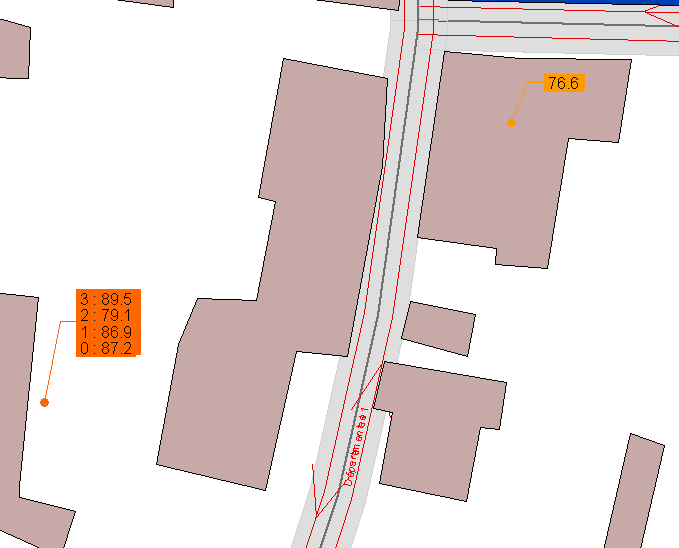 Receivers view - Receivers simulation |
Isovalues
•Iso values i.e. the lines drawn to the level values indicated by the user:
Horizontal simulation |
|
|---|---|
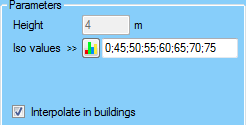 Parameters area iso values |
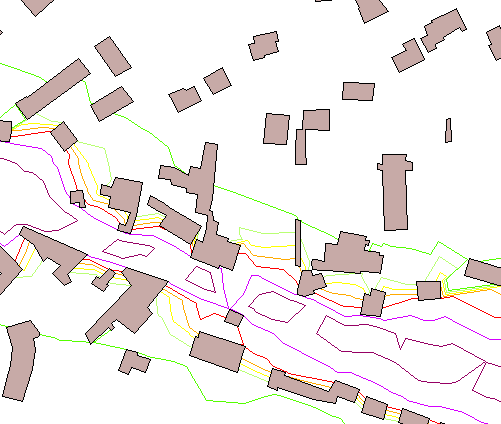 Iso values view |
oThe update iso values window is accessed via the ![]() button (see Update iso values).
button (see Update iso values).
oIso values must be separated by a ';'.
oAll negative values are ignored.
oValues can be entered in any order.
Polygons
•Polygons i.e. areas drawn to the level values entered by the user:
Horizontal simulation |
|
|---|---|
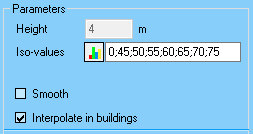 Polygon parameters - Horizontal simulation |
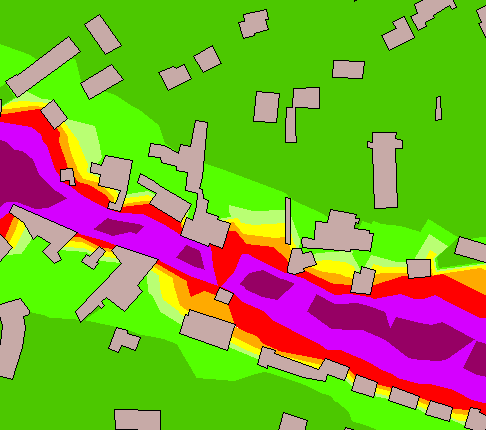 Polygons view |
Facade simulation |
|
|---|---|
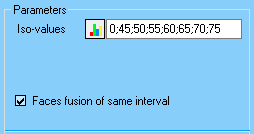 Poygon parameters - Facade simulation |
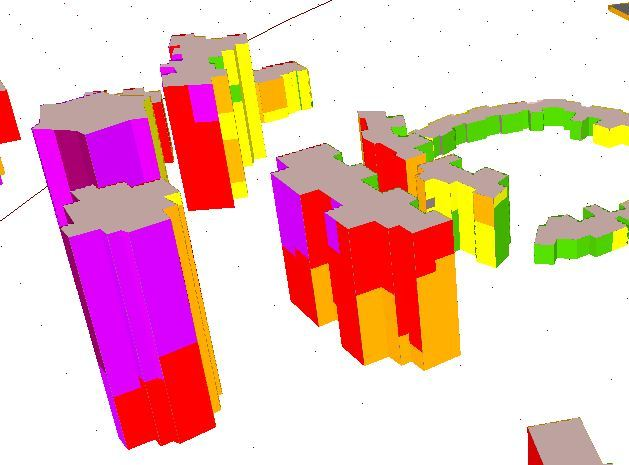 Facade view (3D) |
The ![]() button gives access to the update window for the iso values (see Updating iso values).
button gives access to the update window for the iso values (see Updating iso values).
The Faces fusion of same interval option allows you to concatenate the faces (forming a facade) included in the same value interval. The consequence of this is that fewer face objects are shown in the view. However, if you do not select this option you can retain the exact level of 'face' objects so the information is not impaired.
|
The Facade subtraction -3dB option (or not taking the last facade reflection into account) that appears in the case of maps that include only facade receivers. Therefore, this option appears for: •A horizontal simulation, receiver map. •A facade simulation. The vertical simulation has the same parameters as horizontal maps except for the height and interpolation in buildings. |
|---|