|
<< Click to display Table of content >> Maps |
  
|
|
<< Click to display Table of content >> Maps |
  
|
The user can see a variety of information from a single simulation on a domain.
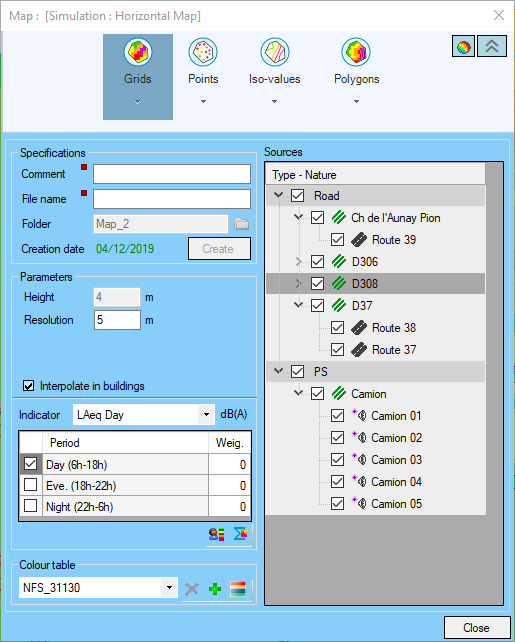
To do this the user can activate/disable the Source natures according to an index and the parameters for each type of representation (resolution, iso values, etc.).
The map is then updated:
•In real time if the dynamic mode is enabled.

Mode dynamic
•At a later time only when dynamic update is disabled.

Mode manual
In relation to the results of the simulation, the user can choose to see:
•The cumulated level for either all Source natures or for a single one.
•The level according to a given indicator that can be modified. By default the indicator corresponding to the periodic division of the simulation are shown in the list.

Map interface
•When the representation mode has been selected, the Create button can be used to create the map: an object file ('*.OBJ') representing the map is written on the disk in the directory of the selected domain (in the sub-directory corresponding to the simulation viewed).