|
<< Click to display Table of content >> Projections |
  
|
|
<< Click to display Table of content >> Projections |
  
|
Definition
A cartographic projection is used to represent the Earth (totally or partially) on a flat surface of a map. It is associated to a coordinate system to locate an object in space using coordinates (X, Y, Z): it has an origin, axis and unit.
The 2 projections of MithraSIG
MithraSIG is using 2 projections:
•The projection of the dataset: projection of a data (associated to a file) by which the objects are positioned.
•The viewing projection: projection used to draw the objects (it can be different of the projection of the dataset).
For MithraSIG, the unit is always metric. That means the data is always visualized in meters, as the GPS data for example. The choice of a non-metric viewing projection results in an alert message.
When creating a project, the user has to choose a viewing projection. It can be modified at any time from the status bar.
![]()
Import data
There are 2 different behaviors when importing data:
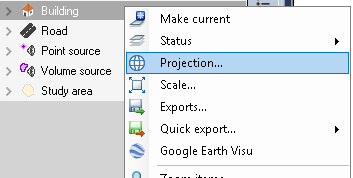
•The imported data gets automatically the viewing projection. The projection can be modified at anytime using the contextual menu on the overlay.

•The inserted data (with the icon ![]() in the overlay list) keeps their original projection and cannot be modified.
in the overlay list) keeps their original projection and cannot be modified.
Projection for export
There are 2 types for exports. Both ways require to set the projection: coordinates will be calculated with this projection.
•Export a chosen overlay: using the contextual menu, click on Exports.... By default, the projection is the one of the selected dataset.

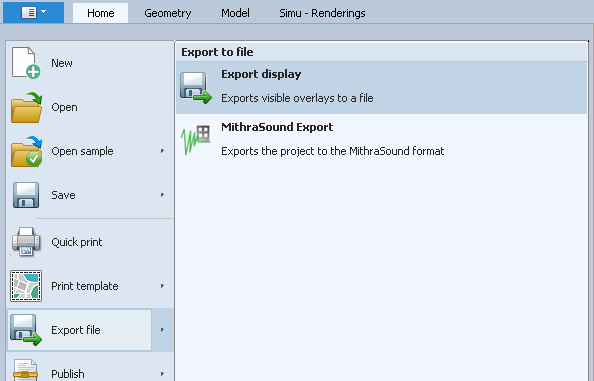
•Export the data of the graphic window: using the menu File/Export file. By default, the projection is the one of the graphic window.
