|
<< Click to display Table of content >> The Maps |
  
|
|
<< Click to display Table of content >> The Maps |
  
|
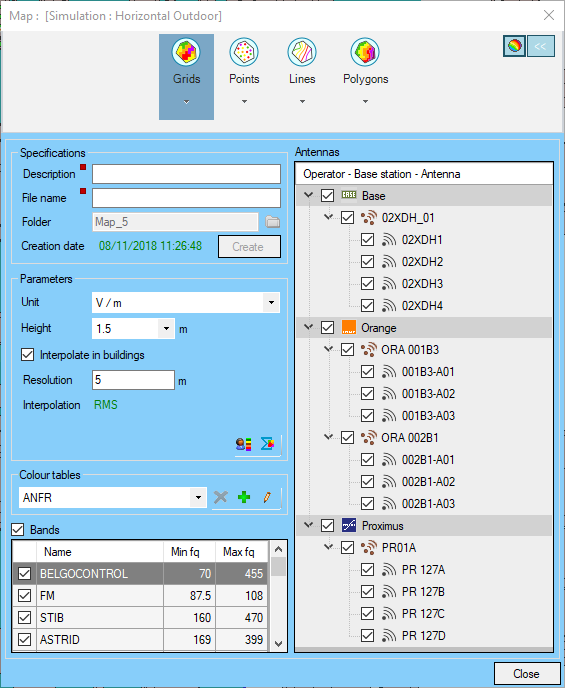
Once a simulation has been run, the user can display the exposition on a domain from any combination of the antennas that were taken into account for the simulation. The user can activate or deactivate antennas or frequency bands.
The map is updated:
•In real time if the dynamic mode is activated:

Dynamic mode ON
•In stack job processing if the dynamic mode is deactivated:

Dynamic mode OFF
A map displays the cumulated exposition from radioelectric transmitters. The use can select the sources to be cumulated to display:
•The cumulated exposition from all the transmitters (all antennas and all frequency bands).
•The cumulated exposition from one or more frequency bands (GSM 900, GSM 1800, UMTS, …).
•The cumulated exposition from one or more antennas or base stations.

Map interface
•Once the sources and parameters defined, the exposition map is displayed. The button Create allows to save the map: a file is created in the directory of the selected simulation.